Work · Frontend Engineer · 2025
TK Hamada
A kindergarten management app that replaced scattered spreadsheets with one place for student records, finances, inventory, and reporting. Built with React 19 and shadcn/ui.
The problem
TK Hamada is a small kindergarten in Indonesia. Around 40 to 50 students. Every day, someone on staff was logging tuition payments, expenses, and inventory movements into Google Sheets. The spreadsheets were duplicated across different people. One person tracked income, another tracked expenses, and nobody was sure which version was the latest.
When the principal needed a monthly report, someone had to manually pull numbers from three different sheets, cross-check totals, and hope nothing was missed. Payments got recorded twice. Expenses fell through the cracks. The staff spent hours every week on work that should have taken minutes.
And there was no way to see the bigger picture. How much did the school collect this month? What is the balance? Which students still owe tuition? Nobody could answer those questions without a manual count.
What I built
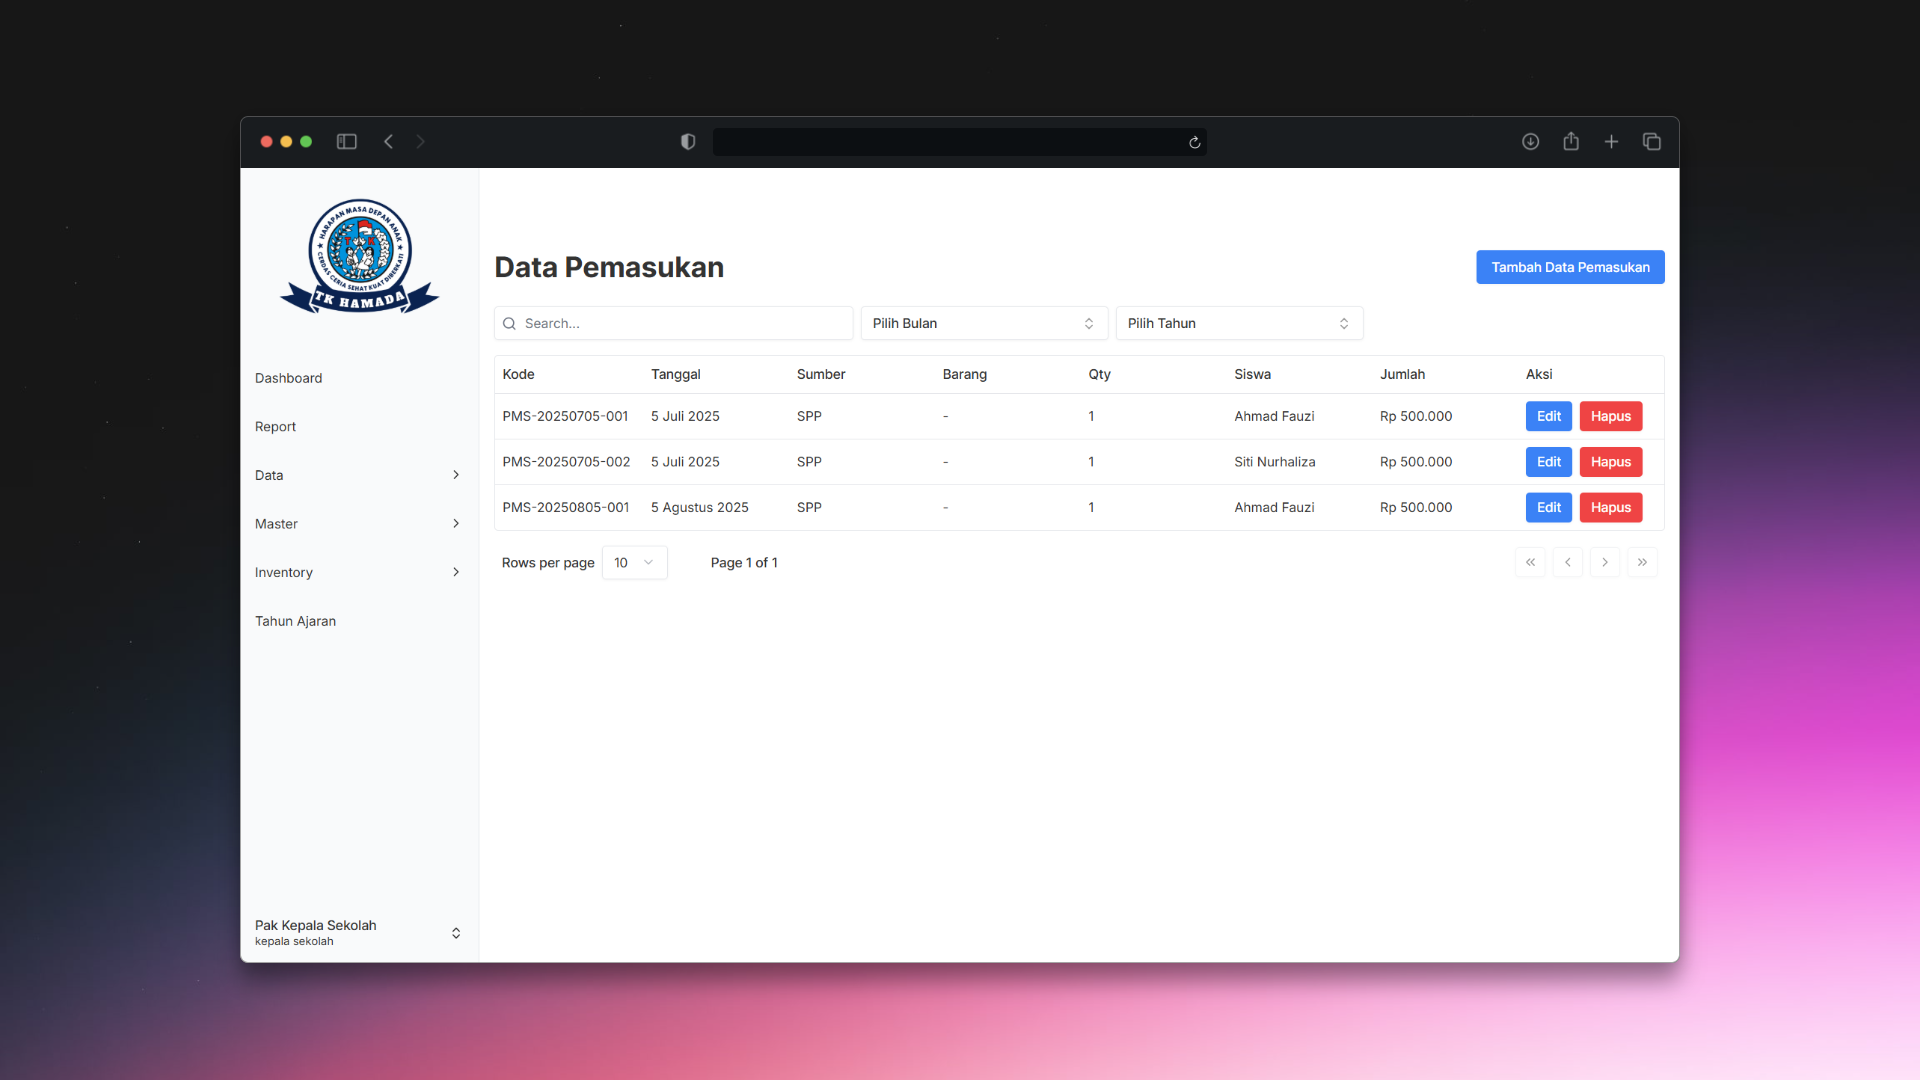
I built a single-page application that replaces all of those spreadsheets with one interface. Student enrollment, tuition tracking with categorized income sources, expense recording, student savings, inventory management for school supplies, and a reporting dashboard with charts. Everything is in Indonesian because that is what the staff works in daily.
The feature that took the most effort was the income form. Staff do not just log one payment at a time. They batch-enter multiple tuition payments in a single session, each tied to a different student and income category. I designed a dynamic form that lets them add detail rows, each with its own student, source, quantity, and amount, then submits the whole batch as one transaction. It sounds simple but getting the validation right took real iteration. Making sure every row is filled, amounts are valid, and the form stays responsive with ten-plus rows.
The three-layer architecture was not something I planned from the start. I originally lumped everything into a flat route structure. When the master data section grew to ten pages, students, products, categories, units, suppliers, villages, income sources, expense sources, other sources, users, I realized I needed to group them logically. Master data, transaction data, and inventory. That split made the sidebar navigation intuitive and kept the codebase from becoming a maze.
The dashboard was also a fun challenge. Admin users get a restricted view. They can manage data but do not need to see financial charts. Staff and the principal get the full dashboard with balance tracking and monthly income versus expense breakdowns. The academic year selector scopes everything, so you are always looking at the right period’s data.
How it works
I chose React 19 with Vite because the dev experience is hard to beat. Instant hot reload, fast builds, and a modern ecosystem. TypeScript catches most bugs before they reach production, which matters when you are dealing with financial data.
The biggest performance win was lazy-loading every page route. The app has 25-plus pages, and without code splitting the initial bundle would be massive. I used React.lazy with Suspense boundaries so each page only loads when the user navigates to it. The difference was noticeable. The login page loads almost instantly, and the rest of the app streams in as needed.
// Pages load on demand, not all at once
const PemasukanPage = React.lazy(() => import("../pages/data/PemasukanPage"));
const PengeluaranPage = React.lazy(() => import("../pages/data/PengeluaranPage"));
Server state was another decision I spent time on. Early on I was using useState and useEffect to fetch data, which meant I was managing loading states, error handling, and caching manually across 21 different data hooks. I switched to TanStack Query, and it cleaned up a lot of boilerplate. Every hook follows the same pattern. Define a query key, point to a service function, and let the library handle caching, refetching, and stale data. When the user navigates back to a page they already visited, the data is there instantly.
The API layer uses a typed envelope pattern. Every response comes back with success, message, data, errors, and metadata, and a central fetch wrapper handles auth headers, error parsing, and response unwrapping. Individual services do not need to think about that. They just call apiClient.get and get back typed data.
For the UI, I used shadcn/ui with Radix primitives. This gave me accessible dialogs, data tables, forms, and tooltips without building anything from scratch. The DynamicDialog component is reused across every create, edit, and delete flow. 18 form components all plug into the same dialog pattern. It keeps the UX consistent and the code DRY.
Reporting pulls data through Recharts for visualizations and supports Excel export. The report page has four tabs. Income, expenses, savings, and inventory. Each with its own data hook and table. The academic year selector at the top scopes all four tabs simultaneously.
Deployment is straightforward. The frontend builds to static files served by Nginx. No container orchestration, no serverless complexity. Just a simple stack that works.